Climate Benefits and Building Energy Efficiency Gains From Improved Roofing Insulation in Cold Climates

This article presents the results of a collaboration among Firestone Building Products (Firestone), Dow Inc., and Oak Ridge National Laboratory (ORNL) to accelerate the market adoption of a new polyisocyanurate foam insulation product that retains its thermal resistance at lower temperatures compared with existing foam products.
Photo by Ryunosuke Kikuno on Unsplash
EDITOR'S NOTE: Certain company products are mentioned by name in the text to specify adequately the experimental procedure and equipment used. In no case does such identification imply recommendation or endorsement by the International Institute of Building Enclosure Consultants, nor does it imply that the equipment is necessarily the best available for the purpose.
T
T he high thermal resistivity of polyisocyanurate insulation is attributed to its closed-cell structure that is filled with low-thermal-conductivity blowing-agent vapor. However, existing polyisocyanurate products exhibit a decrease in their thermal-resistance values at lower temperatures due to the condensation of the blowing agent vapor. Because use of insulation with higher thermal resistivity can lead to improved energy efficiency of commercial buildings, which can result in lower operational greenhouse gas (GHG) emissions, there is a clear need to address this reduced performance at lower temperatures through product innovation.
This article presents the results of a collaboration among Firestone Building Products (Firestone), Dow Inc., and Oak Ridge National Laboratory (ORNL) to accelerate the market adoption of a new polyisocyanurate foam insulation product that retains its thermal resistance at lower temperatures compared with existing foam products.1-4
In the following sections, we discuss the history of polyurethanes (PU) and, specifically, polyisocyanurate foams, highlighting the various product innovations that occurred due to developing environmental constraints. Further, we detail the issue of reduced performance at low temperatures of the existing polyiso-
In this article, the term “carbon” is used synonymously with “carbon dioxide” and “greenhouse gases” when referring to emissions.
cyanurate foam, as well as the research and development of a novel product that addresses this problem. Finally, we describe the thermal performance model, which was used to estimate energy savings for a range of commercial building types in cool to cold climate zones. We also describe a GHG emissions reduction estimation methodology, which was used to quantify the climate benefits associated with the market rollout of the novel polyisocyanu-rate insulation product.
POLYISOCYANURATE FOAM INSULATION History
PUs were invented in 1937 by the German scientist Otto Bayer. These materials were dense, flexible plastics that were used during World War II as a substitute for rubber. In 1954, the accidental introduction of water to the reaction mixture was shown to produce flexible foams. Later, this chemistry was further modified to produce rigid foams. In 1967, the class of materials known as urethane-modified polyisocyanurate foams was introduced.
Polyisocyanurate insulation is produced using three major components: methylene diphenyl diisocyanate (MDI), polyol, and blowing agents. When these three components are mixed, along with small amounts of catalysts and surfactants, an exothermic chemical reaction causes the liquid blowing agent to boil. The resultant blowing agent vapor expands the foam, creating gas-filled cells that provide poly-isocyanurate's high thermal-resistance value. Early versions of these foams used chlorofluorocarbons (CFCs) and hydrochlorofluorocar-bons (HCFCs) as the blowing agent of choice.
The past 35 years have presented the poly-isocyanurate industry with a series of challenges that were primarily driven by environmental regulations. Currently, the polyisocyanurate insulation industry uses hydrocarbon blowing agents—isopentane and n-pentane—which have zero ozone-depletion potential and low global-warming potential. The use of these pentanes as a blowing agent was spurred by a series of environmental events that began in earnest in 1987, causing the polyisocyanurate industry to reformulate the product twice within a decade.
The polyisocyanurate industry had reached its goal of producing a thermally efficient insulation that uses a blowing agent with zero ozone-depletion potential and low global-warming potential. However, one ancillary feature of the changes in blowing agent not immediately appreciated was that the newer blowing agents had boiling points that were higher than the CFC and HCFC counterparts. When the blowing agent in the foam is reduced to temperatures below its boiling temperature, the resultant condensation of the blowing agent decreases the thermal resistance of the foam. The higher boiling temperature meant that this transition began to occur at temperatures observed in building-related applications. In colder climates, the insulation can spend longer periods of time at temperatures where the blowing agent has condensed, affecting its in-service R-value. Developments to reduce this phenomenon were needed.
Foam Performance and Measures to Address
It is known that as the mean temperature decreases, the R-value of most insulation
increases. The two most important factors that influence the R-value as the mean temperature decreases are:
- the radiation component and
- whether the blowing agent condenses.
Condensation with blowing agents such as isopentane and n-pentane typically decreases the R-value. Keeping the isopentane/n-pen-tane from condensing will increase R-value at low mean temperatures. Recent work discussed later in this paper at the Firestone Building Products laboratory was focused on determining which parameters contribute to this issue. Separate solutions have been found.
Several organizations have reported that the polyisocyanurates of today (blown with pentanes) have R-values that are frequent-ly—but not always—lower at a mean temperature of 4.4°C (40°F) compared with those at a mean temperature of 24°C (75°F). It has been noted that the R-value-versus-mean temperature curve is nonlinear for polyisocyanurate, especially around mean temperatures of 4.4°C (40°F) and lower. The R-values of foam produced with CFC or HCFC blowing agents increase as the mean temperatures decrease from 24°C (75°F) to 4.4°C (40°F) and then level off and start to decrease as the mean temperature decreases as the percentage of condensation of the blowing agent increases—as expected. HCFC-141b, an HCFC, follows this trend and has a boiling point of 32°C (90°F) at a pressure of one atmosphere. If condensation of the blowing agent is a determining factor in R-values approaching 4.4°C (40°F), then a 55/45 blend of isopentane/n-pentane should behave similarly because the boiling points of these two pentanes at 1 atmosphere are close to that of HCFC-141b (isopentane: 28°C [82°F]/n-pentane: 36°C [97°F]), but this isn’t true. R-values of isopentane/n-pentane polyiso-cyanurate foam are approximately 10% lower at a mean temperature of 4.4°C (40°F) versus 24°C (75°F). This was unexpected.
Firestone research focused not only on finding solutions to the unexpected behavior, but also on understanding why it existed. This oddity associated with lowered R-values versus lower mean temperatures seemed to occur with polyisocyanurate with pentane blowing agents. Polyisocyanurate foam has a high ratio of reactive NCO groups to OH groups—typi-cally 2.5 and higher. The working theory used in this research was that pentanes are soluble in at least some domain(s) of the polymer. As the cell concentration of the low-conductivity gas decreases, so does the R-value. The partial pressure of high-conductivity gases (nitrogen
and oxygen) increases, and this percentage may be augmented by gases trapped in the cell walls. It seemed reasonable that as the pentanes condense as temperature decreases, the pentanes are being absorbed into the polymer network, which will lead to more pentanes condensing at the same temperature, ultimately decreasing the gaseous pentane concentration until equilibrium is attained.
During the examination of the low mean temperature R-value issue, the problem was conceptualized at the molecular polymer level. If the pentanes were absorbing into the poly-
mer network in the struts and cell walls of the foam—the structural parts of the foam—and if these absorption sites or surface areas are less available for the pentanes to interact with the polymer domain, then the pentanes may not condense as readily. A variety of solvents have proved effective in increasing the R-value at a mean temperature of 4.4°C (40°F) relative to the R-value at a mean temperature of 24°C (75°F). Most of these solvents have boiling points that are higher than the pentanes, but still their 4.4°C (40°F) R-values are better than the control without them.
A® STRUTTM And pipes.
- One-piece design
- Integrated shallow strut allows use of any standard accessory
- Multiple, custom lengths— cut-to-order from 6" to 20" long
- 150 lb. load; 5 lb. per square inch compressive strength
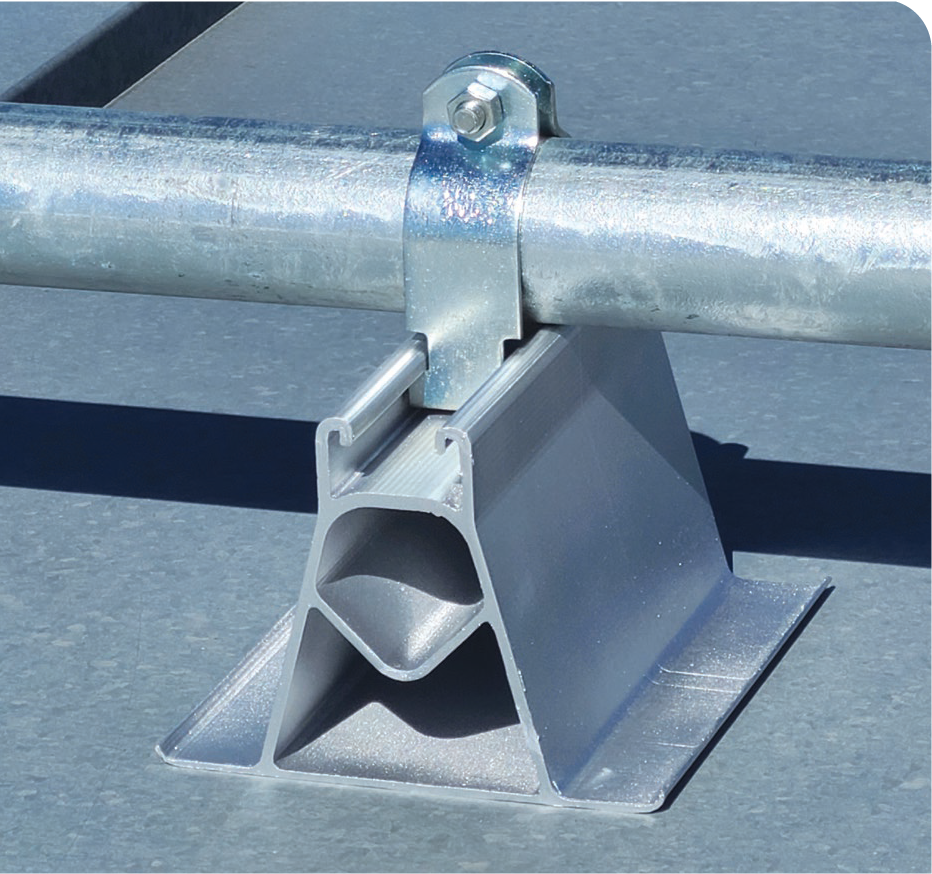
Model MA-6F4 Extruded Aluminum Pipe Support protects roofs.
The new A-Strut Aluminum Pipe Supports from MAPA elevate pipes above roofs, protecting the roof from abrasion and punctures, and the pipes from deterioration caused by movement and rough roofing material.You’re protected from headaches and expenses.
www.MAPAproducts.com
(903) 781-6996
Innovative rooftop supports since 1998
Dow and IOC Partner to Fight Climate Change
The Dow–International Olympic Committee (IOC) carbon partnership was envisioned to facilitate such collaboration on the uniting and empowering platform of sports. Through this platform, Dow has collaborated with innovators such as Firestone Building Products to identify and promote wide-scale adoption of novel, viable solutions for improved energy efficiency of buildings. Buildings in North America account for 40% of total GHG emissions. While many energy-saving technologies exist in the market, in many cases their widespread adoption is lacking. In some cases, that is due to lack of clear performance-based regulation; in other cases, lack of education and awareness is preventing the trades from utilizing such advanced solutions.
Modeling of energy consumption by the building as a function of insulation properties allows practitioners to relate insulation performance to energy and cost savings, thus translating the technical language of foam properties into something that all consumers can understand. In the absence of strict regulation, the authors see this lack of understanding of how insulation choices affect the overall cost of building operations as one of the critical barriers in North America to using more insulation in construction. Education through modeling tools such as the one described here, while made freely available on the Firestone Building Products website, will drive awareness of more energy-efficient and cost-saving insulation choices, and in turn support long-lasting positive change.
Scale is one of the critical pieces needed to successfully address climate change. While it is important to have iconic buildings demonstrating state-of-the-art innovation, it is equally if not more critical to drive adoption of less-glamorous technologies and solutions that provide real and verifiable reductions in energy consumptions by our buildings.
| Insulation | Thermal Conductivity at 24°C (75°F), mW/m•K (BTU/[h•ft•°F]) | Density, kg/m3 (lb/ft3) | Specific Heat, J/(kg•K) (BTU/[lb•°F]) |
| New Formulation | 25.3 (0.015) | 24 (1.5) | 1210 (0.289) |
| Old Formulation | 25.3 (0.015) | 24 (1.5) | 1210 (0.289) |
Table 1. Thermal conductivity, specific heat, and density of insulation.
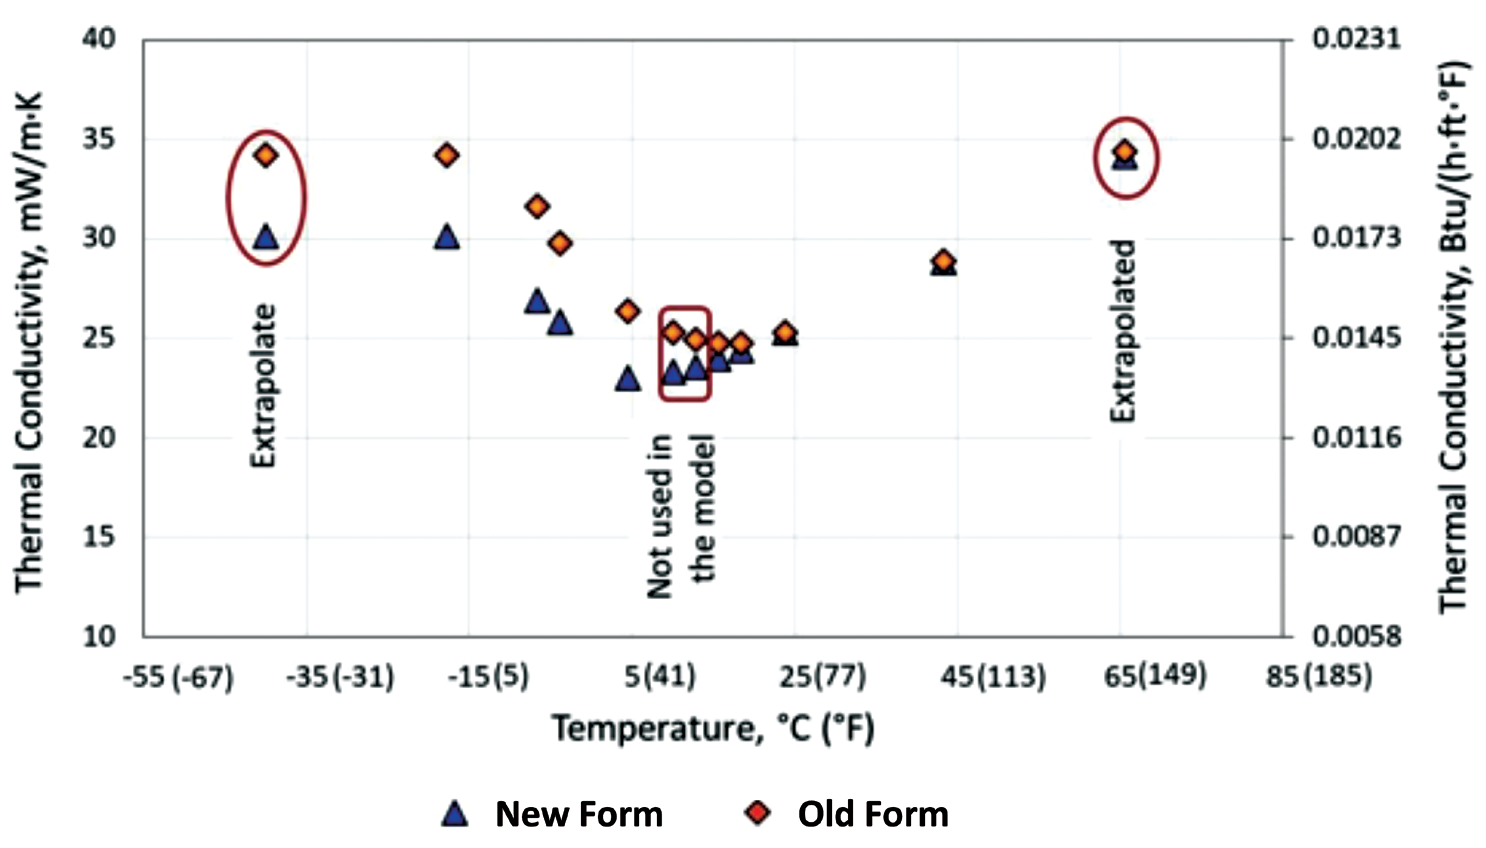
Figure 1. Temperature-dependent thermal conductivity of insulation materials. Note: EnergyPlus allows specifying up to ten pairs of temperature-conductivity sets of inputs for a given material. Therefore, the measured thermal conductivity values of new formulation and old formulation at 13°C (55°F) and 16°C (60°F) were excluded for the temperature-conductivity set inputted in the model (as marked) to limit the pairs of temperature-conductivity to ten sets.
These solvents tie up the sites for either absorption or adsorption because they are better solvents than the pentanes (isopentane and n-pentane), which forces these pentanes to remain in the gaseous phase. Results of this study showed that good solvents yield excellent 4.4°C (40°F) R-value results relative to R-values at 24°C (75°F).
It appears the solubility, as determined by the total Hansen Solubility Parameter (HSP), needs to be about 17.0 and above. The HSP was developed to predict whether one material would dissolve into another, forming a solution. Charles M. Hansen theorized that "like" molecules could bond to one another similar to the way that the same molecules bond together. Generally, nonpolar materials have lower HSPs than polar materials. N-pentane has a total HSP of 14.5. Hexane, with a total HSP of 14.9, did not yield good R-value results at a mean temperature of 4.4°C (40°F) (relative to 24°C/75°F), as expected based on its similarity to n-pentane.
With one exception (methyl formate), all of the solvents, which can also be considered co-blowing agents, have higher boiling points than the isopentane/n-pentane mixture (and methyl formate is about the same) with corresponding lower vapor pressures. At least in some cases, however (for example, acetone, with a low thermal conductivity at 24°C [75°F]), higher R-values at a mean temperature of 24°C (75°F) might be anticipated, and poorer results would be expected at a 4.4°C (40°F) mean temperature due to its lower vapor pressure. However, this is not the case with acetone or the other co-blowing agents. If these co-blowing agents are soluble in the polymer network, then the isopentane and n-pentane are not as free to interact with the polymer network and they remain in the gaseous phase, where they can contribute to R-value at these lower temperatures. Testing of this theory in the laboratory demonstrated that there is not much of a drop-off below 4.4°C (40°F).
The results from the Firestone small-scale laboratory testing were verified in large-scale experiments and further in the production environment. Additionally, Firestone confirmed that this new technology with co-blowing has a synergistic effect with a proprietary solution from one of their business partners. It appears that as the amount of co-blowing agent increases, the ratio of R-values at 4.4°C (40°F) relative to R-values at 24°C (75°F) increases as well. The R-value at a mean temperature of 24°C (75°F) is unaffected, although there may be a slight increase depending on the solvent used. Other work has also shown this effect.
PERFORMANCE MODELING AND CO2E EMISSIONS
It was recognized that, if implemented at scale, this improved thermal-performance foam would yield notable energy savings; however, the new foam’s nonlinear temperature response didn’t allow for the established models to reflect savings accurately. Therefore, there was a need for the development of a new, more accurate model. ORNL joined the collaboration to develop such a model. This model would allow users to relate insulation performance to energy and cost savings, thus translating the technical language of foam properties into something that all consumers could understand, which would facilitate increased adoption of the insulation requirements in the latest energy codes.
Modeling and Energy Calculation
The energy impact of temperature-dependent thermal conductivity of insulation used on commercial building roofs was evaluated using EnergyPlus5 simulations of commercial prototype building models.6 The prototype models include 16 commercial building types in 17 climate locations for recent editions of ASHRAE Standard 90.1 and the International Energy Conservation Code (IECC). The US Department of Energy (DOE) established the models to support the development of commercial building energy codes and standards. The 2006 IECC–compliant building models were used for this study; they were assumed to be representative of the level of insulation used by roofing companies. Building operating parameters—such as internal load, occupancy schedule, thermostat setpoint, and efficiency of the heating and cooling equipment—affect the amount of energy required to maintain desired indoor conditions. All these parameters in the prototype building models were specified to meet the 2006 IECC requirements.
Thermal properties of roof insulation materials in the models were modified to account for the temperature-dependent thermal conductivities. The default heat balance algorithm used in prototype building models is conduction transfer function, which does not account for temperature-dependent thermal properties. Therefore, the heat balance algorithm was changed to conduction finite difference. The simulation time step, which is used in the thermal zone heat balance model calculation as the driving time step for heat transfer and load calculations, was changed to 60 per hour, which is the shortest time step allowed in EnergyPlus. Shorter time steps improve the numerical solution and accuracy of simulation results. No
other input parameters in the commercial prototype building models were modified.
Simulations were completed for six commercial building types in seven climate zones (CZs): Atlanta, Georgia, CZ 3A; Baltimore, Maryland, CZ 4A; Chicago, Illinois, CZ 5A; Minneapolis, Minnesota, CZ 6A; Fargo, North Dakota, CZ 7; Edmonton, Alberta, CZ 7; and Fairbanks, Alaska, CZ 8. Building types were limited to the heated subset of the standard DOE model buildings in order to avoid overestimation of climate benefits. Only cool and cold CZs were considered for this study, guided by
the temperature-dependent nature of the new foam’s thermal conductivities.
Thermal Properties of Polyisocyanurate Insulation Materials
Thermal transport through the building enclosure is a function of construction details and thermal conductivity, specific heat, density of materials, solar reflectance, and thermal emittance of exposed surfaces. Table 1 shows the thermal conductivity at 24°C (75°F), specific heat, and density of two polyisocyanurate insulation materials considered in this study: new


Figure 2. Temperature-dependent thermal conductivity of polyurethane foam blown with CFC-11. Data from Sparks (1982).
formulation and old formulation (existing poly-isocyanurate). Note that the properties of new and old formulations are identical at 24°C (75°F). Figure 1 shows the temperature-dependent thermal conductivity of insulation materials.
The thermal conductivities for new and old formulations were measured at a temperature range from -18°C (0°F) to 43°C (110°F) using a heat flow meter apparatus, following ASTM C518.9 Thermal conductivity at temperatures below -18°C (0°F) and above 44°C (110°F) could not be measured due to the instrument limit. Therefore, an assumption was made to extrapolate the results, based on the thermal conductivity data for a PU foam blown with CFC-11,10 shown in Figure 2. Sparks’10 data show that the thermal conductivity of CFC-11-blown foam gets flat at slightly below -18°C (0°F) and remains flat until the onset of the second deflection point at approximately -57°C (-71°F). Therefore, the thermal conductivity of new and old formulations at temperatures below -18°C (0°F) is assumed to be the same as the thermal conductivity at -18°C (0°F). It is uncertain if this assumption is valid; however, this assumption is only significant when the
temperature is below -18°C (0°F) and would only affect calculations in very cold climates. Similarly, Sparks’10 data show linear correlation between thermal conductivity and temperature above 5°C (41°F). Therefore, the thermal conductivity of new and old formulations at temperatures above 43°C (110°F) was calculated by linear extrapolation using the measured data at 43°C (110°F) and 24°C (75°F). This shape of the curve is common for most (if not all) closed-cell foam insulation over small temperature intervals.
EnergyPlus allows specifying up to ten pairs of temperature-conductivity sets of inputs for a given material. Therefore, the measured thermal conductivity values of new and old formulations at 13°C (55°F) and 16°C (60°F) were excluded for the temperature-conductivity set input in the model (as marked) to limit the temperature-conductivity pairs to ten sets.
Two solar reflectance values of the roof exterior surface were considered—10% and 70%—to simulate black roofing membrane and white roofing membrane, respectively. Thermal emittance of 0.9 was considered for all surfaces. To match the thermal resistance of insu-
lation used in EnergyPlus closely with reality, thickness of insulation was divided into five layers. This allowed EnergyPlus to assign five different thermal conductivity values across the insulation thickness, depending on their temperature at a given time. Dividing insulation into multiple layers is particularly important for materials with nonlinear, temperature-dependent thermal conductivity, such as new and old formulations. Table 2 shows the thickness of each layer of new or old formulations. Different thicknesses are required because of the varying thermal performance levels mandated by the building code.
Energy Savings Calculations
All building models use a natural-gas furnace for heating and either a direct expansion system or water chiller for cooling. Small office prototype buildings use air-source heat pumps with a gas furnace as backup. A 24°C (75°F) cooling setpoint and 21°C (70°F) heating set-point were used for all buildings. However, various thermostat setback temperatures and schedules were used for different building types. Standalone retail, small office, and secondary school buildings assumed 29°C (85°F) for cooling and 16°C (60°F) for heating thermostat setback. Medium office and primary school buildings assumed 27°C (80°F) for cooling and 16°C (60°F) for heating thermostat setback. Mid-rise apartment buildings were assumed not to use any thermostat setback.
Various heating and cooling equipment efficiencies were assumed in different prototype building models. Some building models assume different types of cooling units and cooling coil coefficients of performance (COP) for various zones within a building. Primary and secondary school building models use energy-recovery ventilation systems. Medium office, primary school, and secondary school
| | Atlanta | Baltimore | Chicago | Minneapolis | Fargo | Edmonton | Fairbanks |
| Standalone Retail | 1.32 (0.52) | 1.32 (0.52) | 1.76 (0.69) | 1.76 (0.69) | 2.18 (0.86) | 2.18 (0.86) | 2.18 (0.86) |
| Mid-Rise Apartment | 1.32 (0.52) | 1.32 (0.52) | 1.76 (0.69) | 1.76 (0.69) | 2.18 (0.86) | 2.18 (0.86) | 2.18 (0.86) |
| Medium Office | 1.32 (0.52) | 1.32 (0.52) | 1.76 (0.69) | 1.76 (0.69) | 2.18 (0.86) | 2.18 (0.86) | 2.18 (0.86) |
| Small Office | 2.47 (0.97) | 2.47 (0.97) | 2.47 (0.97) | 2.47 (0.97) | 3.15 (1.24) | 3.15 (1.24) | 3.15 (1.24) |
| Primary School | 1.32 (0.52) | 1.32 (0.52) | 1.76 (0.69) | 1.76 (0.69) | 2.18 (0.86) | 2.18 (0.86) | 2.18 (0.86) |
| Secondary School | 1.32 (0.52) | 1.32 (0.52) | 1.76 (0.69) | 1.76 (0.69) | 2.18 (0.86) | 2.18 (0.86) | 2.18 (0.86) |
Table 2. Required foam thickness for each layer, cm (in.).
| "Modeled Foam Sales Weighted by DOE Buildings Model % - 50 | 000 | 000 ft2 (4.64 million m2) Basis " | ft2 / m2 for Each Modeled Region |
| Standalone Retail | 660,153 | ||
| 15.3% | 61,328 | ||
| Mid-Rise Apartment | 107,598 | ||
| 7.3% | 9996 | ||
| Medium Office | 187,421 | ||
| 6.0% | 17,411 | ||
| Small Office | 53,820 | ||
| 5.6% | 5000 | ||
| Primary School | 646,195 | ||
| 5.0% | 60,032 | ||
| Secondary School | 1,916,241 | ||
| 10.4% | 178,019 |
Note: DOE = US Department of Energy.
Table 3. Allocation of foam sales to the different building types.
building models use variable air volume (VAV) systems with electric reheat. Other building models do not use VAVs. The heat pump heating coil COP for a small office building is modeled as 3.0, and the minimum outdoor dry-bulb temperature for compressor operation is assumed as -12°C (10°F).
Energy use for heating and cooling the buildings to maintain thermostat setpoints was calculated using EnergyPlus. Electrical energy reported in this paper is the sum of energy used for cooling, heating for systems with VAV reheat, blower fans for both heating and cooling, pumps (for systems that use chillers), and heat recovery systems. The natural gas (NG) use reported in this paper is only used for building heating. The natural gas used for other thermal needs—for example, hot water— was excluded from the emissions calculation because it was not affected by the thermal resistance of the roofing foam.
In terms of carbon emission calculations, the NG was burned on site and the emissions are stoichiometric. For the electricity used, the grid factor was used to convert to GHG emissions at the power plant (see Table 3).
CO2e Emission Calculations
With the development of the energy model, there was a corresponding quantification methodology designed to convert energy savings into carbon dioxide equivalent (CO2e) emission reductions. The emission reduction quantification methodology was designed in accordance with the Framework11 and is described below.
Quantification Approach
The emission reduction calculation followed the methodology prescribed in the Framework, which enables carbon footprint owners and corporate partners to create cost-effective, low-carbon projects that mitigate
CBUs = Baseline Life-cycle Emissions – Project Life-cycle Emissions
where
Life-cycle Emissions = Embodied GHG Emissions + Building Emissions
Using abbreviations for embodied carbon (EC), building emissions (BE), baseline (BL), and project (P),
CBUs
Equation 1
a well-delineated and owned footprint, such as an event, while simultaneously addressing technology needs. The quantification methodology was designed in accordance with the Framework SERP/ERPC12 project type. The approach for the calculation of emission reductions, or climate benefit units (CBUs), can be described as in Equation 1.
The embodied carbon emissions quantification methodology is described in section II.B.2, and the building emissions quantification methodology is described in section II.B.3.
Embodied Carbon (EC) Quantification
The system boundary for the EC quantification was the processes and material flows directly used in the material acquisition, preprocessing, production, distribution, storage, use, and end of life of the polyisocyanurate foam insulation, as outlined in Figure 3. It is assumed that everything else is unchanged by the foam replacement, including, for example, fasteners and jobsite waste.
The functional unit was determined to be 1 ft3 (0.028 m3) of polyisocyanurate foam insulation, which has a mass of 0.63 kg (1.4 lb). The change in blowing agent will not alter the installation functionality or mass of the final unit, and the baseline and project products will be interchangeable in use. The end user will not know the formulation of the foam panel.
The general equation to quantify EC is shown in Equation 2.
The principal difference between the old formulation (baseline) and the new formulation (project) is the composition of the blowing agent, and as such most of the other materials can be conservatively excluded from the quantification. Table 4 provides the justification for inclusion/ exclusion across the system boundary.
Therefore, as previously mentioned, conservative exclusions are shown in Equation 3.
Building Emissions (BE) Quantification
The BE reduction quantification methodology calculates the reduction in scope 1 and 2 GHG emissions13 due to a reduction in energy demand expected in the buildings that have used the project insulation (new formulation) compared with the same building using the baseline insulation (old formulation). Due to the nature of the foams, emission reductions
Figure 3. System boundaries of the carbon quantifications for the polyisocyanurate foam insulation and included life-cycle stages.
EC = AL × C × (EIMAP + EIP + EID&S + EIU + EIEOL)
where
AL = activity level: sales of functional unit in cubic feet (cubic meters)
C = unit conversion
EIMAP = emissions intensity of material acquisition and processing stage (mass CO2e/mass)
EIP = emissions intensity of production stage (mass CO2e/mass)
EID&S = emissions intensity of distribution and storage stage (mass CO2e/mass)
EIU = emissions intensity of use stage (mass CO2e/mass)
EIEOL = emissions intensity of end-of-life stage (mass CO2e/mass)
Equation 2
| Life-Cycle Stage Assessment | Inclusion Justification | |
| Material Acquisition, Preprocessing, and Production | Blowing agent | Included – different baseline (old) and project (new) blowing agents |
| Other materials | Excluded – identical in baseline and project scenarios | |
| Distribution and Storage | Excluded – identical in baseline and project scenarios | |
| Use and End-of-life | Blowing agent | Excluded – since baseline blowing agent has equivalent or higher GWP than the project blowing agents,* the exclusion is conservative. |
| Other materials | Excluded – Identical in baseline and project scenarios |
Equation 3
occur when the foam is exposed to prolonged temperatures below 4.4°C (40°F) (see Fig. 1). The energy savings quantities from reduced electricity (Table 5) and natural gas (Table 6) use are converted to GHG emission reduction quantities using the natural gas combustion emission factor and the regional electricity grid data (Table 7), respectively. The DOE describes a standard building’s structure in
Table 4. Life-cycle stage inclusion justification.
The Collaboration
On September 14, 2017, the IOC and The Dow Chemical Company, a Worldwide Olympic Partner, announced Dow as the Official Carbon Partner of the IOC.1 Building on the Olympic Agenda 2020, the IOC has developed a comprehensive Sustainability Strategy, which includes a carbon neutrality objective for the IOC. In line with this agenda, this new partnership delivers an innovative global carbon mitigation program to compensate carbon emissions from the IOC's daily operations, as well as other projects to be identified within the Olympic Movement.
In close collaboration with the IOC, Dow is implementing a diverse portfolio of projects with its customers, in markets including infrastructure, manufacturing, transport, and packaging materials. The partnership builds on successful carbon mitigation programs implemented by Dow and the Organizing Committees of the Sochi 2014 Olympic Games and Rio 2016 Olympic Games, and significantly extends the programs’ reach and influence on a global scale. The Dow-IOC partnership has the goal to deliver third-party-verified GHG emissions reductions from projects developed in accordance with the Dow Climate Solutions Framework (the Framework).2 The Framework enables carbon footprint owners and corporate partners to create cost-effective, low-carbon projects that mitigate a well-delineated and owned footprint, such as an event, while simultaneously addressing technology needs. The Framework enables a structured yet flexible approach to quantify and mitigate emissions and leave a positive social and economic legacy, while incorporating existing best practices from the carbon market with a rigorous approach to developing a portfolio of GHG mitigation projects that go beyond business as usual.
Making it the first carbon mitigation project in North America under the Official Carbon Partnership between Dow and the IOC, Dow has collaborated with Firestone Building Products (Firestone),3 a manufacturer of roofing and wall solutions for commercial buildings.
In this project, Dow supported the creation of an energy modeling tool to accurately describe reductions in cost, energy, and GHG emissions of commercial structures that use innovative polyisocyanurate roofing insulation from Firestone and to assess the tool’s accuracy. This new formulation, developed by Firestone and supported by Dow PU raw materials, addresses low-temperature decreases in thermal resistance values at lower temperatures without compromising other performance metrics.
The energy modeling tool, which is available on Firestone’s website,4 was developed by ORNL with funding support from Dow. ORNL’s focus is to develop new building technologies enabling grid-interactive efficient buildings that provide beneficial effects to energy security and affordability, resilience, environment, and the US economy. With this new energy modeling tool, commercial architects, property owners, roof consultants, and construction companies can evaluate the potential long-term reductions in whole-building energy use and associated GHG emissions resulting from installation of the newly formulated Firestone polyisocyanurate foam roofing insulation.
| | Climate Zone | |||||||||
| 3A | 4A | 5A | 6A | 7 | 7 | 8 | ||||
| Building Type | Roof Area | Surface Reflectivity | Atlanta | Baltimore | Chicago | Minneapolis | Fargo | Edmonton | Fairbanks | |
| Standalone Retail | 24,692 ft2 (2294 m2) | 70% | kWh | 17 | 78 | 108 | 206 | 156 | 172 | 297 |
| kBTU | 57 | 265 | 370 | 701 | 531 | 588 | 1014 | |||
| 10% | kWh | 225 | 106 | 156 | 222 | 203 | 228 | 344 | ||
| kBTU | 768 | 360 | 531 | 758 | 692 | 777 | 1175 | |||
| Mid-Rise Apartment | 8435 ft2 (784 m2) | 70% | kWh | -33 | -31 | -33 | -31 | -42 | -50 | -44 |
| kBTU | -114 | -104 | -114 | -104 | -142 | -171 | -152 | |||
| 10% | kWh | 28 | 17 | 6 | 3 | -17 | -31 | -31 | ||
| kBTU | 95 | 57 | 19 | 9 | -57 | -104 | -104 | |||
| Medium Office | 17,876 ft2 (1661 m2) | 70% | kWh | 858 | 1492 | 1869 | 2431 | 2394 | 2697 | 4042 |
| kBTU | 2929 | 5090 | 6379 | 8293 | 8170 | 9203 | 13,791 | |||
| 10% | kWh | 800 | 1367 | 1642 | 2119 | 1953 | 2306 | 3672 | ||
| kBTU | 2730 | 4663 | 5602 | 7232 | 6663 | 7867 | 12,530 | |||
| Small Office | 5500 ft2 (511 m2) | 70% | kWh | 22 | 53 | 119 | 153 | 156 | 172 | 175 |
| kBTU | 76 | 180 | 408 | 521 | 531 | 588 | 597 | |||
| 10% | kWh | 19 | 44 | 100 | 128 | 106 | 131 | 167 | ||
| kBTU | 66 | 152 | 341 | 436 | 360 | 445 | 569 | |||
| Primary School | 73,960 ft2 (6871 m2) | 70% | kWh | 319 | 742 | 208 | 383 | 2283 | 2511 | 4875 |
| kBTU | 1090 | 2531 | 711 | 1308 | 7791 | 8568 | 16,634 | |||
| 10% | kWh | 347 | 608 | 94 | 422 | 1831 | 1822 | 4500 | ||
| kBTU | 1185 | 2076 | 322 | 1441 | 6246 | 6218 | 15,355 | |||
| Secondary School | 105,444 ft2 (9796 m2) | 70% | kWh | 1233 | 3453 | 1217 | 1658 | 4922 | 7314 | 9192 |
| kBTU | 4208 | 11,781 | 4151 | 5658 | 16,795 | 24,956 | 31,363 | |||
| 10% | kWh | 1656 | 3725 | 1256 | 8133 | 4261 | 5717 | 8450 | ||
| kBTU | 5649 | 12,710 | 4284 | 27,752 | 14,540 | 19,506 | 28,833 |
Table 5. Electricity savings per building type per year (kWh/kBTU).
terms of interior area and number of floors. The roof area was estimated based on the DOE’s reference building area and number of floors (not counting below-grade floors), and the emissions savings quantity was normalized by roof area. The monitored activity is new formulation sales data, converted into units of roof area, provided by Firestone, and was categorized by building type and CZ (Table 3). This activity-level data set was multiplied by the normalized GHG emission reduction quantities by building type and CZ to yield the total GHG emission savings by building type and location. These quantities were summed to determine the GHG BE derived from the sales of the new formulation as a replacement for the old formulation (Table 8).
The calculations for the building energy use and emissions are the same. The GHG emission calculation is used for reference.
ΔBE = BEBL – BEP
Here, the BE quantity (BEQ) is the emissions output (EO) for the building divided by the roof area (RA).
For the base case building, that is
BEFP is calculated in a similar manner using the output from the building containing the new formulation. The emission savings is the difference.
The emission reductions from foam sales into a region by building type are
Note that these data are used for illustrative purposes and will be replaced by actual sales data for the annual calculation and third-party verification of emission savings.
Program Results
The annual climate benefits seen from one year of sales are the sum of the climate benefits from each region and building type that uses the new insulation formulation in one year, for conditioned buildings. For this program, the 20-year lifetime savings from each year of sales will be counted (Table 9).
For foam sold and installed in 2019, shown in Equation 4, the total climate benefits are calculated as
| | Climate Zone | |||||||||
| 3A | 4A | 5A | 6A | 7 | 7 | 8 | ||||
| Building Type | Roof Area | Surface Reflectivity | Atlanta | Baltimore | Chicago | Minneapolis | Fargo | Edmonton | Fairbanks | |
| Standalone Retail | 24,692 ft2 (2294 m2) | 70% | kWh | 2053 | 3772 | 4228 | 5708 | 7183 | 7131 | 11,075 |
| kBTU | 7005 | 12,871 | 14,426 | 19,478 | 24,511 | 24,330 | 37,789 | |||
| 10% | kWh | 1692 | 3064 | 3456 | 4775 | 6161 | 6244 | 10,231 | ||
| kBTU | 5772 | 10,454 | 11,791 | 16,293 | 21,023 | 21,307 | 34,908 | |||
| Mid-Rise Apartment | 8435 ft2 (784 m2) | 70% | kWh | 1031 | 1817 | 2089 | 2728 | 2833 | 3019 | 4483 |
| kBTU | 3516 | 6199 | 7128 | 9308 | 9668 | 10,303 | 15,298 | |||
| 10% | kWh | 831 | 1503 | 1761 | 2342 | 2464 | 2656 | 4169 | ||
| kBTU | 2834 | 5128 | 6009 | 7990 | 8407 | 9061 | 14,227 | |||
| Medium Office | 17,876 ft2 (1661 m2) | 70% | kWh | 350 | 144 | 150 | 222 | 200 | 219 | 217 |
| kBTU | 1194 | 493 | 512 | 758 | 682 | 749 | 739 | |||
| 10% | kWh | 297 | 125 | 133 | 231 | 294 | 297 | 303 | ||
| kBTU | 1014 | 427 | 455 | 787 | 1005 | 1014 | 1033 | |||
| Small Office | 5500 ft2 (511 m2) | 70% | kWh | 11 | 50 | 178 | 336 | 519 | 450 | 1294 |
| kBTU | 38 | 171 | 607 | 1147 | 1772 | 1535 | 4417 | |||
| 10% | kWh | 8 | 39 | 156 | 289 | 494 | 425 | 1242 | ||
| kBTU | 28 | 133 | 531 | 986 | 1687 | 1450 | 4237 | |||
| Primary School | 73,960 ft2 (6871 m2) | 70% | kWh | 1669 | 3458 | 4119 | 9006 | 19,939 | 13,175 | 44,839 |
| kBTU | 5696 | 11,800 | 14,056 | 30,728 | 68,034 | 44,955 | 152,997 | |||
| 10% | kWh | 1639 | 4258 | 3372 | 7506 | 16,581 | 12,036 | 42,517 | ||
| kBTU | 5592 | 14,530 | 11,506 | 25,610 | 56,575 | 41,069 | 145,073 | |||
| Secondary School | 105,444 ft2 (9796 m2) | 70% | kWh | 8964 | 18,672 | 16,822 | 24,344 | 49,108 | 46,756 | 96,992 |
| kBTU | 30,586 | 63,712 | 57,400 | 83,067 | 67,565 | 159,537 | 330,949 | |||
| 10% | kWh | 8947 | 17,447 | 14,522 | 19,019 | 42,358 | 43,264 | 92,722 | ||
| kBTU | 30,529 | 59,532 | 49,552 | 64,897 | 144,533 | 147,623 | 316,381 |
Using the modeled sales distribution among building types and the sales projection for two years after the year of introduction, installation of approximately 80,000 m2 (860,000 ft2) of the improved roofing foam will reduce GHG emissions by over 1.4 million metric tons CO2e versus roofing foam made with the older blowing agents.
CONCLUSION
The novel polyisocyanurate foam insulation described in this article retains its thermal resistance at lower temperatures compared with existing foam insulation products, which experience reduction in their thermal resistance. By addressing this issue, the improved polyisocyanurate foam enables better insulation and higher energy efficiency of buildings in colder climates. In this study, the energy consumption of commercial buildings was estimated by including a temperature-dependent insulation conductivity model for use in
| "Electricity GHG / unit delivered | kg CO2e/GJ (lb CO2e/kBTU) " | |||||
| 3A | 4A | 5A | 6A | 7 | 7 | 8 |
| Atlanta | Baltimore | Chicago | Minneapolis | Fargo | Edmonton | Fairbanks |
| 441.7 | 455.5 | 434.7 | 371.9 | 344.0 | 344.0 | 68.1 |
| 0.00092 | 0.00095 | 0.00091 | 0.00078 | 0.00072 | 0.00072 | 0.00014 |
Note: GHG = greenhouse gas.
Table 7. Electric grid GHG emission factors per location.
whole-building energy simulations, allowing practitioners to relate insulation performance to energy consumption and cost savings from building use. The education of practitioners and consumers through modeling tools such as the one described here—made freely available on Firestone's website—will drive awareness on more energy-efficient and cost-saving insulation choices, enabling long-lasting positive change.
The modeling indicates that the two years of sales of the new roofing insulation, installed on a variety of nonresidential buildings, has
the potential to save 1.4 million metric tons of CO2e over a 20-year insulation lifetime.
The Dow-IOC Carbon Partnership facilitated the collaboration with Firestone and ORNL to promote and accelerate the market adoption of the new roofing insulation with improved performance at lower temperatures. This collaboration is part of the overall effort to increase the widespread adoption of energy-saving technologies, which, at scale, is a critical piece to transitioning to a low-carbon future.
| Tonnes CO2e (kip CO2e) | 3A | 4A | 5A | 6A | 7 | 7 | 8 | |
| Surface Reflective | Atlanta | Baltimore | Chicago | Minneapolis | Fargo | Edmonton | Fairbanks | |
| Standalone Retail | 70% | 11 | 22 | 26 | 36 | 41 | 41 | 57 |
| (24) | (49) | (57) | (79) | (91) | (91) | (126) | ||
| 10% | 18 | 20 | 24 | 32 | 38 | 39 | 54 | |
| (40) | (44) | (52) | (70) | (83) | (85) | (118) | ||
| Mid-Rise Apartment | 70% | 2 | 4 | 4 | 6 | 6 | 6 | 11 |
| (4) | (8) | (10) | (13) | (13) | (14) | (23) | ||
| 10% | 3 | 4 | 4 | 6 | 6 | 6 | 10 | |
| (6) | (9) | (10) | (12) | (12) | (13) | (22) | ||
| Medium Office | 70% | 15 | 26 | 31 | 35 | 31 | 35 | 11 |
| (33) | (57) | (68) | (76) | (69) | (78) | (24) | ||
| 10% | 14 | 24 | 27 | 30 | 26 | 31 | 10 | |
| (31) | (52) | (60) | (66) | (57) | (67) | (22) | ||
| Small Office | 70% | 0 | 1 | 2 | 3 | 3 | 3 | 3 |
| (1) | (2) | (5) | (6) | (6) | (6) | (6) | ||
| 10% | 0 | 1 | 2 | 2 | 2 | 2 | 3 | |
| (1) | (2) | (4) | (5) | (5) | (5) | (6) | ||
| Primary School | 70% | 7 | 16 | 10 | 19 | 57 | 49 | 84 |
| (16) | (36) | (21) | (42) | (126) | (107) | (185) | ||
| 10% | 8 | 16 | 7 | 17 | 47 | 39 | 79 | |
| (17) | (35) | (15) | (38) | (103) | (87) | (174) | ||
| Secondary School | 70% | 66 | 167 | 92 | 123 | 278 | 324 | 372 |
| (146) | (366) | (202) | (271) | (612) | (713) | (817) | ||
| 10% | 78 | 170 | 85 | 263 | 240 | 276 | 354 | |
| (172) | (375) | (187) | (578) | (529) | (607) | (778) |
Table 8. Calculated annual emission reductions (in tonnes or kilopounds CO2e) based on modeled sales.
ACKNOWLEDGMENTS
This manuscript has been authored in part by UT-Battelle LLC, under contract DE-AC0500OR22725 with the U.S. DOE. The U.S. government retains and the publisher, by accepting the article for publication, acknowledges that the U.S. government retains a nonexclusive, paid-up, irrevocable, worldwide license to publish or reproduce the published form of this manuscript, Sales or allow others to do so, m2 (ft2)for U.S. government purposes. The DOE will 4,645,000 provide public access to (50,000,000) these results of federal- 2,694,100 ly sponsored research in (29,000,000) accordance with the DOE Public Access Plan (http:// 37,160,000 energy.gov/downloads/ (400,000,000) doe-public-access-plan). 37,160,000
of Science User Facility operated by ORNL. A Dow-BTRIC User Agreement funded the research.
2017, https://www.olympic.org/news/ ioc-names-worldwide-top-partner-dow-as-official-carbon-partner.
REFERENCES
- International Olympic Committee, "IOC Names Worldwide Top Partner Dow as Official Carbon Partner," September 14,
- United Nations Global Compact, "Caring for Climate Hosts Inaugural Business Forum to Co-Create Climate Change Solutions," November 19, 2013, https://unglobalcompact.org/
This research used resources at the Building Technologies Research and Integration Center (BTRIC), a DOE Office
| | ER/year | Years | Building ER | Embodied Carbon | Total ER | |
| t (kip) CO2e | Year sold | 20-year lifetime | ||||
| 4252.4 | t CO2e | |||||
| (9355.3) | kip CO2e | |||||
| 2466 | 2019 | 2039 | 49,328 | -218 | 49,110 | |
| (5426) | 108,522 | -479 | 108,043 | |||
| 34,019 | 2020 | 2040 | 680,386 | -3000 | 677,386 | |
| (74,842) | 1,496,850 | -6601 | 1,490,249 | |||
| 34,019 | 2021 | 2041 | 680,386 | -3000 | 677,386 | |
| (400,000,000) | (74,842) | 1,496,850 | -6601 | 1,490,249 | ||
| Program | t CO2e | 1,410,100 | -6218 | 1,403,882 | ||
| kip CO2e | 3,102,221 | 13,680 | 3,088,541 |
Table 9. Emission reductions (ER) based on projected sales of new insulation formulation and a 20-year lifetime.
news/661-11-19-2013.
- https://www.firestonebpco.com
- Firestone Building Products, "Firestone ISOGARDTM," https://www.fires-tonebpco.com/us-en/roofing/insula-tion/isogard.
- US Department of Energy Building Technologies Office, "EnergyPlus," https://energyplus.net/.
- US Department of Energy, "Commercial Prototype Building Models," https:// www.energycodes.gov/development/ commercial/prototype_models.
- International Code Council (ICC), International Energy Conservation Code (Country Club Hills, IL: ICC, 2006).
- Thermal resistance is the reciprocal of
Som Shrestha is a Building Scientist at ORNL with 11+ years of research experience developing technologies to enhance building energy efficiency, including new high-per for mance insulation materials and phase-Som Shrestha, Ph.D. change materials. Dr. Shrestha’s current work includes developing thermally anisotropic building envelopes that can redirect unwanted heat and harvest thermal energy and develop models for porous insulation materials and validate them with experimental data.
Ella is an Analyst in the Climate and Decarbonization team at Anthesis. Before joining Anthesis she held an analyst role at NatureBank and worked on emissions reduction activities and carbon project development. She holds a Ella Baz BSc in Environmental Geoscience from the University of Bristol, and an MSC in Industrial Ecology from Delft University of Technology.
thermal conductance.
- ASTM Subcommittee C16.30, Standard Test Method for Steady-State Thermal Transmission Properties by Means of the Heat Flow Meter Apparatus, ASTM C518 (West Conshohocken, PA: ASTM International, 2017).
- L. L. Sparks, Thermal Conductivity of a Polyurethane Foam from 95 K to 340 K, NBSIR 82-1664 (Boulder, CO: National Bureau of Standards, US Department of Commerce, 1982).
- The Dow Chemical Company, "Document Request Form," http://cli-ent.dow.com/Sustainability-in-Sport-Request.
- SERP (Societal Emission Reduction
André O. Desjarlais is the program manager for the Building Envelope and Urban Systems Research Program at the Oak Ridge National Laboratory (ORNL). He has been involved in building enclosure and materials André O. Desjarlais research for over 45 years. Desjarlais serves on ASTM Committees C16 on Thermal Insulation and D08 on Roofing, was chair of ASTM’s Committee on Technical Committee Operations (COTCO), and was awarded the title of Fellow in 2011. He also serves on Technical Committees TC 4.4 on Thermal Insulation and Building Systems, TC 1.8 on Mechanical Insulation Systems, and TC 1.12 on Moisture Control in Buildings, and is past chairman of TC 4.4. Desjarlais is also a founding director of the RCI Foundation.
Edward Klonowski is the Product Manager for Insulation and Coatings at Firestone Building Products. He received his masters in mechanical engineering from the University of Michigan in 2006 and has spent the last Edward Klonowski 13 years in product management. His insulation focus includes both rigid and spray in place polyisocyanurate insulation. He currently sits on the board of directors for PIMA (Polyisocyanurate Manufacturers Association).
Program): An emission reduction program where the uncertainty associated with the emissions reductions precludes it from producing Principal Sphere emissions reductions. ERPC (Emission Reductions from Product Comparison): Emission reductions are generated by comparing the embodied GHG emissions of a new product and the embodied GHG emissions of functionally equivalent incumbent pro-duct(s) in the marketplace.
- Scope 1 and 2 GHG emissions are defined by Greenhouse Gas Protocol (https://ghgprotocol.org/) as direct emissions (scope 1) and emissions associated with purchased power (scope 2).
John B. Letts is the Technical Director, Insulations/Research Fellow in the technology department of Firestone Building Products Co. He received his doctorate degree in chemistry from Ohio State University in 1982. John B. Letts He has over 33 years of experience in urethane technology, from research and technology to technical service to plant support. His primary experience is in polyisocyanurate insulation board and its performance in roof and wall systems, with extensive urethane knowledge and experience in spray, pour in place, flexible foam, elastomers and adhesives. Dr. Letts’ research has focused on the chemistry, processing and application of polyisocyanurate boards.
Daniel Howard is an R&D Assistant Staff Member in the Building Envelope Materials Research Group at ORNL. He has nearly 3 years of experience in FEA, whole-building energy, and computational modeling as they apply to material per-Daniel Howard formance (both thermal and mechanical) and energy savings. His current research includes development of modular overclad panels, identification of facer properties to prevent insulative foam aging, and anisotropic thermal management system optimization and performance characterization.
Anastasia (Ana) Behr is a Carbon Director in Dow Corporate Sustainability Group, responsible for engaging with internal/ external stakeholders to drive implementation of Dow’s decar-bonization strategy. Prior, she led the Anastasia Behr, development and Ph.D. implementation of carbon projects with Dow customers in North America, as part of the Dow-IOC Carbon Partnership. Her expertise areas include colloidal and biomedical research; sustainable event management; carbon accounting and mitigation. Ana holds a Ph.D. in chemical engineering from University of Minnesota.
Simon is the Director of Clean Technology & Industrial Innovation at NatureBank, a climate services company and global leader in the design, development, and implementation of carbon projects. He is responsible for the sourcing of high Simon Phillips value emissions reduction projects, and leads NatureBank’s work in the areas of clean technology project development and advisory. He holds a BASc in Environmental Chemical Engineering from the University of Waterloo, and an MSc in Environmental Management from the University of London’s Centre for Development, Environment and Policy.
Mike Mazor is a retired Research Fellow and Building Scientist from Dow. He is a staff researcher and member of the External Advisory Board for the Center for Sustainable Systems at The University of Mike Mazor, Ph.D. Michigan. In addition, he is a consultant for NatureBank (Vancouver) with a focus in carbon mitigation. His specialties include modeling and simulation, US plastics economy, use phase life cycle analysis of energy saving and low carbon solutions, and the development and implementation of verified carbon mitigation projects.
Please address reader comments to elorenz@iibec.org, including “Letter to Editor” in the subject line, or IIBEC, IIBEC Interface Journal, 434 Fayetteville St., Suite 2400, Raleigh, NC 27601.
New Library Encourages Readers to Have Their Heads in the Clouds

Photo by ArchExist.
Skylights dot the roof of the building, complemented by an outdoor rooftop terrace. Photo by CreatAR Images.
A new library on the southern tip of China, dubbed “The Cloudscape of Haikou,” uses “flowing, sculptural concrete” to create a shape evocative of clouds and intended to blur the boundaries between inside and outside. The 11,000-sq.-ft. campus includes a 7,500-sq.-ft. library building which visitors can “flow in and out of.” Using CNC-cut and 3-D-printed models, the designers created a space that does not have a single right angle. Skylights dot the roof of the building, complemented by an outdoor rooftop terrace. The curtainwall includes retractable glass doors and curved sliding doors. The roof and floors are double-layered “waffle slabs,” which support the cantilever. Over half of the building’s surface is covered in windows and doors, reinforcing the lack of delineation between the interior and exterior spaces. The exterior space includes a reflecting pool, plants, a café, bike storage, a nursery, and a sandy area.
— designboom, MAD, archdaily
Windows and glass doors cover more than half of the building’s walls, bringing the outside in. Photo by ArchExist.
Categories
Operations and Maintenance